Earth Community Organization (ECO)
the Global Community
Theme
Climate change prelude
the Global Community
Theme
Climate change prelude
1.0 Leaders, issues and articles concerned with above theme Read
2.0 What is climate change? What has caused the climate to change? Read
3.0 The greatest threat to all life on Earth is a trace element. Read
4.0 Global warming tic-O-tack! Read
5.0 Results from studies on climate change. Read
6.0 Local and global impacts. Read
7.0 Storing excess carbon in terrestrial and ocean systems. Read
8.0 British Columbia’s battlefield for life. Read
9.0 Preventive actions to climate change. Read
Leaders, issues and articles concerned with above theme |
The following articles were copied from issues 1, 25, 26, 28, 30, 32, 36, and 47 listed on the website.
1. Protection of the global life-support systems.
[ Participate ]
There are many related aspects of the global life-support systems that are affected by an overpopulated planet:
* global warmingNovember 2003 Newsletter: 3.1, 5.0
* Ozone layer
* wastes of all kind including nuclear and release of radiation
* climate change
* species of the fauna and flora becoming extinct
* losses of forest cover and of biological diversity
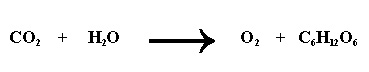
* the capacity for photosynthesis
* the water cycle
* food production systems
* genetic resources
* chemicals produced for human use and not found in nature and, eventually, reaching the environment with impacts on Earth's waters, soils, air, and ecology
April 2003 Newsletter: 8D
November 2002 Newsletter: 2A, 2B, 2F
December 2002 Newsletter: 2C, 2D, 2F, 2G
January 2003 Newsletter: 2F
Press release #9
25. The Kyoto Protocol is everyone's business on Earth. [ Participate ]
October 2002 Newsletter: 7INovember 2002 Newsletter: 2F, 2I
December 2002 Newsletter: 2C, 2D
April 2003 Newsletter: 8D
August 2003 Newsletter: 6B
November 2003 Newsletter: 3.1
Press release #9
26. Earth rights and the Scale of Human and Earth Rights. [ Participate ]
December 2002 Newsletter: 2G, 2FJanuary 2003 Newsletter: 2F
February 2003 Newsletter: 2I, 2J, 2K, 2L
August 2003 Newsletter: 8B, 8C
28. Preventive actions against the worst polluters on the planet and those who destroy the global life-support systems. [ Participate ]
August 1999 Newsletter: 4.bNovember 1999 Newsletter: 12.e, 12.f
December 2002 Newsletter: 2G
January 2003 Newsletter: 2B, 2F
February 2003 Newsletter: 2G
May 2003 Newsletter: 7F
October 2003 Newsletter: 3C, 5A, 7I, 7K
Press release #9
30. Scenarios of what might be humanity's future. [ Participate ]
June 2000 Newsletter: 8November 2002 Newsletter: 2H
January 2003 Newsletter: 2E
32. Global strategies. [ Participate ]
November 2002 Newsletter: 2QDecember 2002 Newsletter: 2E, 2F, 2G, 2H
January 2003 Newsletter: 2F
Press release #9
36. A global sustainable development. [ Participate ]
November 1999 Newsletter: 12.cJune 2000 Newsletter: 6, 7, 12
January 2003 Newsletter: 2G, 2H, 2K, 2L
February 2003 Newsletter: 2I, 2J, 2L
47. Climate change adaptation. [ Participate ]
October 2002 Newsletter: 7INovember 2002 Newsletter: 2F, 2I
December 2002 Newsletter: 2C, 2D
April 2003 Newsletter: 8D
August 2003 Newsletter: 6B
November 2003 Newsletter: 3.1
Press release #9
What is climate change? What has caused the climate to change? |
A) What is climate change?
It refers to changes in the Earth’s climate as a whole.
It refers to changes in the average temperature, precipitation and wind patterns that a given region is experiencing. A standard climate model takes into account factors such as:
The warming of the atmosphere over recent decades has been uneven. It is greater over mid-latitudes (40 - 70 degrees N). Antarctica has warmed at more than twice the global rate in the last 50 years, causing several of its ice shelves to disintegrate.
What has caused the climate to change?
Over time these factors affected the Earth’s climate in different ways. This is best represented by the global warming time scale.
In this paper we are concerned about today, our future, and what we should do to adapt to changes caused by the Earth’s climate changing rapidly with time.
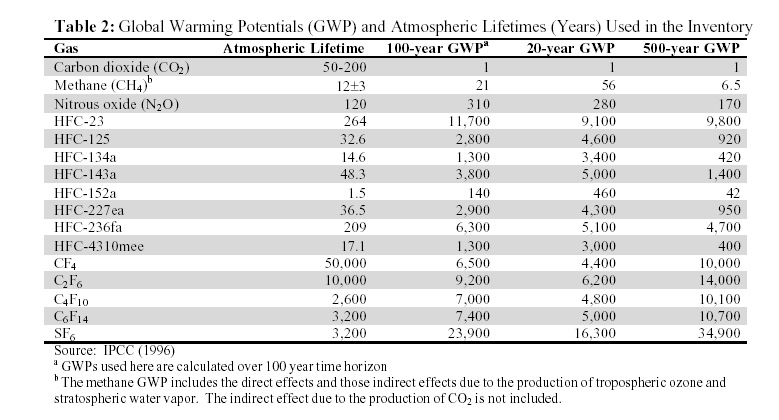
The concentrations of several greenhouse gases have increased over time due to human activities, such as:
We will see that these greenhouse gas emissions worldwide are the cause of the global warming of the planet, and the global average temperature change.
The following figure was obtained from the I.P.C.C., UNEP Grid Arendal, and shows the combined land surface, air, and sea surface temperatures.
The following figure shows well that as the CO2 concentrations increase so does the global average temperature.

There are plenty of physical observations of the change in the average temperature of the Earth’s atmosphere. The melting of glaciers, warming of the permafrost, and native observations over time have been well known and discussed. The following figure shows three curves of what might be the global average temperature between now and year 2100.

Nanaimo has seen summer temperatures in the middle of the month of May is another observation.
Night-time minimum temperatures in most regions of BC are warmer on average than they were a century ago, particularly in spring and summer. Higher minimum temperatures in spring may increase the length of the frost-free season. In summer they may prevent buildings from cooling down during the night.
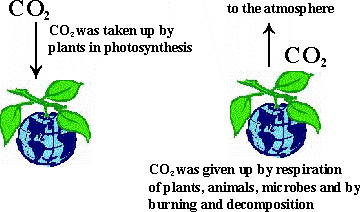
Greenhouse gases are responsible for changes in global climate.
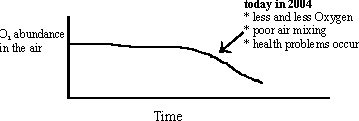
When we drive our cars, and light, heat, and cool our homes, we generate greenhouse gases. And we also burn the Oxygen of the air.
Drivers affect three global life-support systems by:
* creating the global warming of the planet
* changing the global climate, and
* burning the Oxygen of the atmosphere
Global warming refers to a period of increase in the average temperature of the Earth's atmosphere and oceans. It is generally used to refer to the increase currently occurring, and to imply "as a result of human activity". The more neutral term climate change is used for periods of increase or decrease, or indeed change in non-temperature variables, with no particular implication of human cause. The Earth's climate system is inherently unstable and global warming can precipitate sudden climate shifts as have been discovered to have occurred within the Earth's recent past. Because climate change will likely continue in the coming decades, denying the likelihood or downplaying the relevance of past abrupt events could be costly.
In its last report, IPCC stated that average surface temperature is projected to increase by 1.4 to 5.8 °C over the period 1990 to 2100, and the sea level is projected to rise by 0.1 to 0.9 metres over the same period.
Global warming can trigger a sudden change (a shut down, basically) in an ocean current that warms Northern latitudes. If that happened, we'd have sudden and dramatic cooling, as this ocean "conveyor belt" that warms Northern Europe stopped. This change has happened in the past in response to dramatic climate changes. There are records of as much as 10°C temperature swings in just a few years in regions affected by this ocean current. This shut down is apparently caused by pulses of fresh water coming into the N Atlantic from melting glaciers and ice caps, and from the increased precipitation associated with the previous warming. Whether this kind of abrupt change may be on the horizon is hotly debated at present. Nevertheless, phenomena such this serve to remind us that the global climate system is probably full of surprises!
Climate scientists generally agree that Earth has undergone several cycles of global warming and global cooling in the last 20,000 years. The IPCC estimates that surface temperatures have risen by around 0.6°C since the late 19th century.
Causes of global warming are:
Some of these causes are human in origin, such as deforestation. Others are natural, such as solar variation. The greenhouse effect includes both human causes, such as the burning of fossil fuel, and natural causes, such as volcanic emissions.
Greenhouse gases are transparent to certain wavelengths of the sun's radiant energy, allowing them to penetrate deep into the atmosphere or all the way to the Earth's surface, where they are re-emitted as longer wavelength radiation, mostly in the infrared region.
Greenhouse gases and clouds prevent some of this radiation from escaping, trapping the heat near the Earth's surface where it warms the lower atmosphere. Alteration of this natural barrier of atmospheric gases can raise or lower the mean global temperature of the Earth.
Based on the position of Earth relative to the sun and characteristics of Earth's surface, the average temperature of Earth's surface should be -18°C. However, the mean temperature is closer to +15°C.
Thus without an atmosphere capable of trapping and re-radiating energy, the earth's surface would be below freezing (about - 18°C) rather than the current +15°C (59°F). Thus, Earth is warmed largely from trapping and re-radiation of heat -- infrared radiation -- by gases and particles in the atmosphere. This trapping and re-radiation of heat by gases in the atmosphere is called the "greenhouse effect."
Therefore, Earth's temperature is not simply a function of our distance from the sun, but also of gases in our atmosphere.
It refers to changes in the Earth’s climate as a whole.
It refers to changes in the average temperature, precipitation and wind patterns that a given region is experiencing. A standard climate model takes into account factors such as:
1. The variation in the radiation balance of the Earth;
2. Greenhouse gas concentrations;
3. The hydrological cycle of precipitation;
4. The melting of glaciers and the Greenland ice cap;
5. Deforestation;
6. Land use conversion;
7. The ice and snow fields;
8. Contamination of the atmosphere;
9. Absorption of heat by the oceans;
10. Changes in the ecosystems of the Earth and in biodiversity;
11. Urban growth;
12. Volcanic activities; and
13. Photosynthesis in terrestrial and ocean systems.
The warming of the atmosphere over recent decades has been uneven. It is greater over mid-latitudes (40 - 70 degrees N). Antarctica has warmed at more than twice the global rate in the last 50 years, causing several of its ice shelves to disintegrate.
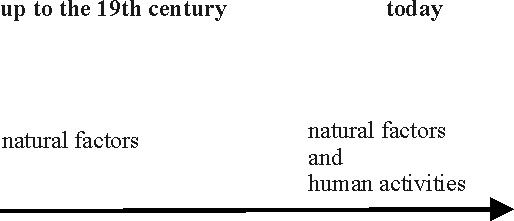
What has caused the climate to change?
1. Natural factors such as the solar radiation variability and volcanic activities.
2. Human activities such as deforestation and greenhouse gas emissions.
Over time these factors affected the Earth’s climate in different ways. This is best represented by the global warming time scale.
In this paper we are concerned about today, our future, and what we should do to adapt to changes caused by the Earth’s climate changing rapidly with time.
The concentrations of several greenhouse gases have increased over time due to human activities, such as:
* burning of fossil fuels and deforestation leading to higher carbon dioxide concentrations,
* cattle farming and pipeline losses leading to higher methane concentrations,
* the use of CFCs in refrigeration and fire suppression systems.
We will see that these greenhouse gas emissions worldwide are the cause of the global warming of the planet, and the global average temperature change.
The following figure was obtained from the I.P.C.C., UNEP Grid Arendal, and shows the combined land surface, air, and sea surface temperatures.
The following figure shows well that as the CO2 concentrations increase so does the global average temperature.
There are plenty of physical observations of the change in the average temperature of the Earth’s atmosphere. The melting of glaciers, warming of the permafrost, and native observations over time have been well known and discussed. The following figure shows three curves of what might be the global average temperature between now and year 2100.
Nanaimo has seen summer temperatures in the middle of the month of May is another observation.
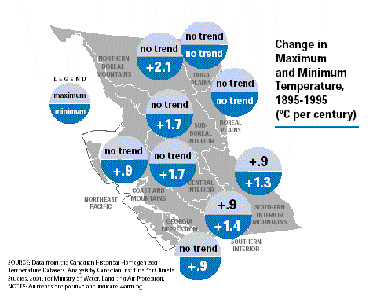
Night-time minimum temperatures in most regions of BC are warmer on average than they were a century ago, particularly in spring and summer. Higher minimum temperatures in spring may increase the length of the frost-free season. In summer they may prevent buildings from cooling down during the night.
Change in Maximum and Minimum Temperature,
British Columbia 1895-1995
(ºC per century)
British Columbia 1895-1995
(ºC per century)
Greenhouse gases are responsible for changes in global climate.
When we drive our cars, and light, heat, and cool our homes, we generate greenhouse gases. And we also burn the Oxygen of the air.
Drivers affect three global life-support systems by:
* creating the global warming of the planet
* changing the global climate, and
* burning the Oxygen of the atmosphere
Global warming refers to a period of increase in the average temperature of the Earth's atmosphere and oceans. It is generally used to refer to the increase currently occurring, and to imply "as a result of human activity". The more neutral term climate change is used for periods of increase or decrease, or indeed change in non-temperature variables, with no particular implication of human cause. The Earth's climate system is inherently unstable and global warming can precipitate sudden climate shifts as have been discovered to have occurred within the Earth's recent past. Because climate change will likely continue in the coming decades, denying the likelihood or downplaying the relevance of past abrupt events could be costly.
In its last report, IPCC stated that average surface temperature is projected to increase by 1.4 to 5.8 °C over the period 1990 to 2100, and the sea level is projected to rise by 0.1 to 0.9 metres over the same period.
Global warming can trigger a sudden change (a shut down, basically) in an ocean current that warms Northern latitudes. If that happened, we'd have sudden and dramatic cooling, as this ocean "conveyor belt" that warms Northern Europe stopped. This change has happened in the past in response to dramatic climate changes. There are records of as much as 10°C temperature swings in just a few years in regions affected by this ocean current. This shut down is apparently caused by pulses of fresh water coming into the N Atlantic from melting glaciers and ice caps, and from the increased precipitation associated with the previous warming. Whether this kind of abrupt change may be on the horizon is hotly debated at present. Nevertheless, phenomena such this serve to remind us that the global climate system is probably full of surprises!
Climate scientists generally agree that Earth has undergone several cycles of global warming and global cooling in the last 20,000 years. The IPCC estimates that surface temperatures have risen by around 0.6°C since the late 19th century.
Causes of global warming are:
1.The trapping of heat by greenhouse gases (greenhouse effect)
2.Variation in the output of the sun (solar variation)
3.Reflectivity of the earth's surface (see deforestation)
Some of these causes are human in origin, such as deforestation. Others are natural, such as solar variation. The greenhouse effect includes both human causes, such as the burning of fossil fuel, and natural causes, such as volcanic emissions.
Greenhouse gases are transparent to certain wavelengths of the sun's radiant energy, allowing them to penetrate deep into the atmosphere or all the way to the Earth's surface, where they are re-emitted as longer wavelength radiation, mostly in the infrared region.
Greenhouse gases and clouds prevent some of this radiation from escaping, trapping the heat near the Earth's surface where it warms the lower atmosphere. Alteration of this natural barrier of atmospheric gases can raise or lower the mean global temperature of the Earth.
Based on the position of Earth relative to the sun and characteristics of Earth's surface, the average temperature of Earth's surface should be -18°C. However, the mean temperature is closer to +15°C.
Thus without an atmosphere capable of trapping and re-radiating energy, the earth's surface would be below freezing (about - 18°C) rather than the current +15°C (59°F). Thus, Earth is warmed largely from trapping and re-radiation of heat -- infrared radiation -- by gases and particles in the atmosphere. This trapping and re-radiation of heat by gases in the atmosphere is called the "greenhouse effect."
Therefore, Earth's temperature is not simply a function of our distance from the sun, but also of gases in our atmosphere.
The greatest threat to all life on Earth is a trace element. |
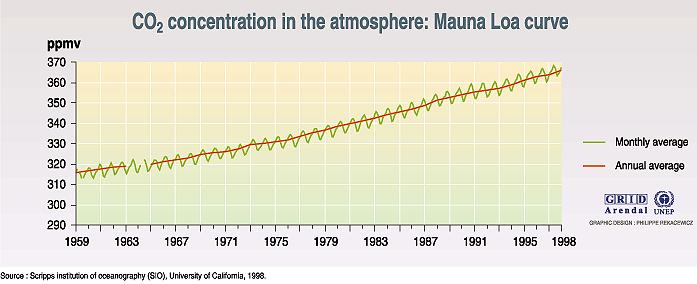
There is evidence that concentrations of CO2 in the atmosphere are related to global temperatures. Evidence is from a variety of sources and reflects relationships between gas concentrations and temperatures over a wide range of time scales. Whenever there is an increase in CO2 concentrations there is also an increase in the temperature of the air and in global precipitation.
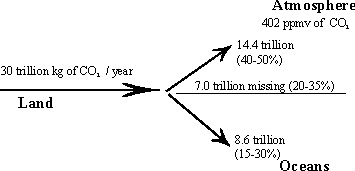
Since monitoring began in the 50s, fossil fuels burning was found to be the major contributor of the increase in CO2 concentrations in the atmosphere and, therefore, of the increase in air temperature causing global warming of the planet. Concentrations have increased approximately 21% since 1958. The average rate of increase since 1958 has been about 0.4%/year, which is an absolute increase of about 1.5 parts per million by volume (ppmv). In year 2005, the predicted value will be 402 ppmv. CO2 persists for a long time in the atmosphere and has a residence time in the order of decades to a century.
While Canada contributes only about 2% of total global GHG emissions, it is one of the highest per capita emitters, largely the result of its size, climate (i.e., energy demands), and resource based economy. In 1990, Canadians released 21.9 t CO2 eq of GHGs per capita. Over the 11-year period from 1990 to 2001, this has increased to 23.1 t CO2 eq of GHGs per capita.

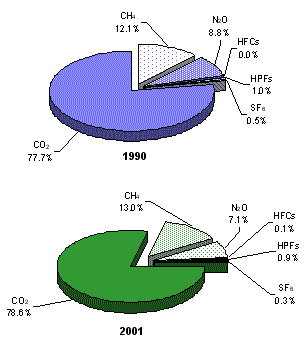
Carbon Dioxide is, by far, the largest contributor to Canada's GHG emissions. The following figure shows how little the percentage contributions of the 6 GHGs has changed between 1990 and 2001. CO2 has only changed in proportion from 77.7% of emissions in 1990 to 78.9% in 2001.
Per capita emissions of greenhouse gases (GHGs) in British Columbia decreased by 6.3% between 1990 and 1999. Total emissions increased by 20% over the same time period. The increase in total GHG emissions was partly due to population growth, but increased emissions from the transportation sector played the largest role. The transportation sector is the single largest source of GHG emissions in British Columbia, producing 42% of the total. If current trends continue, the increase in British Columbia’s total GHG emissions from 1990 to 2010 is expected to be 38%, one of the largest predicted increases in Canada. In 1999, total GHG emissions were 63.5 megatonnes of carbon dioxide equivalent, an increase of 10.8 megatonnes or 20% since 1990. Population growth accounts for part of the increase in total GHG emissions; however, the increase in emissions from the transportation sector exceed the population growth rate.Transportation is the single largest source in the province, accounting for 42% of the total emissions. GHG emissions are strongly influenced by energy prices and economic activity. A decrease in GHG emissions in the early 1980s (not shown above) was largely attributed to increasing energy costs and the economic recession.

BC greenhouse gas emissions by sector, year 2000
Since monitoring began in the 50s, fossil fuels burning was found to be the major contributor of the increase in CO2 concentrations in the atmosphere and, therefore, of the increase in air temperature causing global warming of the planet. Concentrations have increased approximately 21% since 1958. The average rate of increase since 1958 has been about 0.4%/year, which is an absolute increase of about 1.5 parts per million by volume (ppmv). In year 2005, the predicted value will be 402 ppmv. CO2 persists for a long time in the atmosphere and has a residence time in the order of decades to a century.
While Canada contributes only about 2% of total global GHG emissions, it is one of the highest per capita emitters, largely the result of its size, climate (i.e., energy demands), and resource based economy. In 1990, Canadians released 21.9 t CO2 eq of GHGs per capita. Over the 11-year period from 1990 to 2001, this has increased to 23.1 t CO2 eq of GHGs per capita.
Carbon Dioxide is, by far, the largest contributor to Canada's GHG emissions. The following figure shows how little the percentage contributions of the 6 GHGs has changed between 1990 and 2001. CO2 has only changed in proportion from 77.7% of emissions in 1990 to 78.9% in 2001.
Per capita emissions of greenhouse gases (GHGs) in British Columbia decreased by 6.3% between 1990 and 1999. Total emissions increased by 20% over the same time period. The increase in total GHG emissions was partly due to population growth, but increased emissions from the transportation sector played the largest role. The transportation sector is the single largest source of GHG emissions in British Columbia, producing 42% of the total. If current trends continue, the increase in British Columbia’s total GHG emissions from 1990 to 2010 is expected to be 38%, one of the largest predicted increases in Canada. In 1999, total GHG emissions were 63.5 megatonnes of carbon dioxide equivalent, an increase of 10.8 megatonnes or 20% since 1990. Population growth accounts for part of the increase in total GHG emissions; however, the increase in emissions from the transportation sector exceed the population growth rate.Transportation is the single largest source in the province, accounting for 42% of the total emissions. GHG emissions are strongly influenced by energy prices and economic activity. A decrease in GHG emissions in the early 1980s (not shown above) was largely attributed to increasing energy costs and the economic recession.
BC greenhouse gas emissions by sector, year 2000
* agriculture and forestry 5 %
* waste 8 %
* oil and gas industry 14 %
* electricity 4 %
* transportation 39 %
* residential 7 %
* commercial 5 %
* other industry 18 %
| 1990 | 1991 | 1992 | 1993 | 1994 | 1995 | 1996 | 1997 | 1998 | 1999 | 2000 | 2001 | |
|---|---|---|---|---|---|---|---|---|---|---|---|---|
| TOTAL | 52,900 | 52,700 | 51,500 | 54,200 | 56,000 | 60,000 | 62,700 | 61,400 | 62,000 | 64,600 | 66,100 | 65,000 |
| ENERGY | 42,200 | 41,600 | 40,900 | 43,000 | 45,100 | 49,300 | 51,800 | 50,400 | 51,300 | 53,500 | 54,700 | 53,900 |
| a. Stationary Combustion Sources | 19,000 | 17,700 | 16,400 | 17,900 | 17,900 | 20,000 | 21,500 | 19,100 | 19,500 | 21,500 | 22,300 | 21,500 |
| Electricity and Heat Generation | 1,170 | 1,040 | 1,270 | 2,340 | 2,180 | 2,700 | 768 | 1,190 | 1,870 | 1,520 | 2,690 | 3,260 |
| Fossil Fuel Industries | 3,890 | 3,130 | 1,950 | 1,060 | 1,970 | 2,770 | 4,790 | 3,010 | 3,670 | 5,200 | 3,800 | 3,060 |
| Mining | 253 | 225 | 271 | 336 | 202 | 163 | 449 | 344 | 324 | 228 | 316 | 250 |
| Manufacturing Industries | 5,930 | 5,390 | 4,910 | 5,250 | 5,390 | 6,210 | 6,810 | 6,360 | 5,960 | 6,500 | 7,120 | 6,950 |
| Construction | 304 | 268 | 317 | 340 | 283 | 198 | 207 | 126 | 100 | 86 | 76 | 70 |
| Commercial & Institutional | 2,820 | 3,070 | 3,180 | 3,560 | 3,290 | 3,360 | 3,400 | 3,290 | 2,880 | 2,960 | 3,390 | 3,040 |
| Residential | 4,310 | 4,180 | 4,100 | 4,590 | 4,370 | 4,400 | 4,920 | 4,530 | 4,450 | 4,730 | 4,600 | 4,480 |
| Agriculture & Forestry | 323 | 375 | 374 | 374 | 205 | 155 | 191 | 270 | 253 | 263 | 315 | 357 |
| b. Transportation Combustion Sources | 19,800 | 20,300 | 20,700 | 21,000 | 22,400 | 23,900 | 24,500 | 25,400 | 25,800 | 26,100 | 26,300 | 25,600 |
| Domestic Aviation | 1,910 | 1,970 | 2,010 | 1,780 | 2,030 | 2,430 | 2,700 | 2,950 | 2,970 | 3,340 | 3,340 | 2,580 |
| Road Transportation | 12,400 | 12,500 | 12,600 | 13,100 | 13,900 | 14,300 | 14,400 | 15,000 | 15,500 | 15,500 | 15,400 | 15,400 |
| Gasoline Automobile | 5,370 | 5,320 | 5,300 | 5,360 | 5,410 | 5,320 | 5,250 | 5,380 | 5,450 | 5,330 | 5,100 | 4,920 |
| Light Duty Gasoline Trucks | 2,770 | 2,980 | 3,220 | 3,490 | 3,780 | 3,990 | 4,140 | 4,560 | 4,860 | 5,140 | 5,180 | 5,300 |
| Heavy Duty Gasoline Vehicles | 355 | 412 | 481 | 558 | 640 | 706 | 708 | 667 | 827 | 623 | 596 | 532 |
| Motorcycles | 39.2 | 38.4 | 39.2 | 38.6 | 39.6 | 39.3 | 38.3 | 43.0 | 44.9 | 47.4 | 46.4 | 45.1 |
| Diesel Automobiles | 75.0 | 70.8 | 68.0 | 65.7 | 63.1 | 58.6 | 64.8 | 65.9 | 69.4 | 71.5 | 64.6 | 59.6 |
| Light Duty Diesel Trucks | 79 | 60 | 49 | 43 | 40 | 37 | 34 | 41 | 39 | 26 | 60 | 64 |
| Heavy Duty Diesel Vehicles | 2,920 | 2,840 | 2,890 | 3,020 | 3,300 | 3,530 | 3,710 | 3,850 | 3,750 | 3,950 | 4,060 | 4,170 |
| Propane & Natural Gas Vehicles | 782.0 | 769.0 | 582.0 | 491.0 | 622.0 | 571.0 | 407.0 | 403.0 | 482.0 | 313.0 | 331.0 | 325.0 |
| Railways | 1,470 | 1,430 | 1,640 | 1,670 | 1,680 | 1,690 | 1,620 | 1,470 | 1,400 | 1,430 | 1,300 | 1,070 |
| Domestic Marine | 1,030 | 1,130 | 1,150 | 1,140 | 1,180 | 1,240 | 1,140 | 1,040 | 1,010 | 1,130 | 1,240 | 1,580 |
| Others | 2,950 | 3,290 | 3,230 | 3,400 | 3,660 | 4,280 | 4,680 | 4,950 | 4,950 | 4,690 | 4,970 | 4,980 |
| Off Road | 2,100 | 2,200 | 2,200 | 2,280 | 2,420 | 2,910 | 3,190 | 3,520 | 3,390 | 3,300 | 3,340 | 3,140 |
| Pipelines | 845 | 1,090 | 1,040 | 1,110 | 1,240 | 1,370 | 1,490 | 1,430 | 1,560 | 1,390 | 1,630 | 1,840 |
| c. Fugitive Sources | 3,460 | 3,600 | 3,840 | 4,100 | 4,820 | 5,430 | 5,770 | 5,840 | 5,930 | 5,880 | 6,080 | 6,810 |
| Coal Mining | 487 | 482 | 355 | 470 | 512 | 569 | 630 | 657 | 553 | 490 | 478 | 522 |
| Oil and Natural Gas | 2,970 | 3,120 | 3,480 | 3,630 | 4,300 | 4,860 | 5,140 | 5,180 | 5,380 | 5,390 | 5,600 | 6,290 |
| INDUSTRIAL PROCESSES | 2,840 | 2,830 | 2,550 | 3,210 | 3,390 | 3,350 | 2,880 | 2,990 | 2,780 | 2,940 | 3,280 | 2,650 |
| a. Mineral Production | 843 | 781 | 668 | 947 | 1,020 | 1,060 | 1,070 | 1,120 | 1,080 | 1,050 | 1,200 | 1,190 |
| Cement | 678 | 620 | 668 | 761 | 827 | 853 | 872 | 911 | 864 | 826 | 971 | 979 |
| Lime | 165 | 161 | 171 | 186 | 196 | 205 | 202 | 211 | 211 | 221 | 224 | 208 |
| b. Chemical Industry2 | - | - | - | - | - | - | - | - | - | - | - | - |
| Nitric Acid Production | - | - | - | - | - | - | - | - | - | - | - | - |
| Adipic Acid Production | - | - | - | - | - | - | - | - | - | - | - | - |
| c. Metal Production | 1,290 | 1,290 | 1,310 | 1,320 | 1,270 | 1,140 | 1,150 | 1,150 | 1,170 | 1,210 | 1,200 | 1,080 |
| Iron and Steel Production | - | - | - | - | - | - | - | - | - | - | - | - |
| Aluminum Production | 1,290 | 1,290 | 1,310 | 1,320 | 1,270 | 1,140 | 1,150 | 1,150 | 1,170 | 1,210 | 1,200 | 1,080 |
| SF6 used in Magnesium Smelters | - | - | - | - | - | - | - | - | - | - | - | - |
| d. Consumption of Halocarbons1 | - | - | - | - | - | - | - | - | - | - | - | - |
| e. Other & Undifferentiated Production2 | 711 | 758 | 574 | 944 | 1,100 | 1,150 | 662 | 714 | 534 | 685 | 883 | 381 |
| SOLVENT & OTHER PRODUCT USE | 50 | 51 | 52 | 54 | 56 | 57 | 59 | 60 | 60 | 61 | 61 | 62 |
| AGRICULTURE | 2,580.0 | 2,490.0 | 2,560.0 | 2,610.0 | 2,730.0 | 2,770.0 | 2,830.0 | 2,840.0 | 2,580.0 | 2,680.0 | 2,620.0 | 2,790.0 |
| a. Enteric Fermentation | 909.0 | 926.0 | 949.0 | 942.0 | 1,010.0 | 1,050.0 | 1,050.0 | 1,020.0 | 979.0 | 976.0 | 960.0 | 1,000.0 |
| b. Manure Management | 467.0 | 472.0 | 476.0 | 487.0 | 527.0 | 546.0 | 554.0 | 554.0 | 556.0 | 563.0 | 571.0 | 591.0 |
| c. Agriculture Soils | 1,200.0 | 1,090.0 | 1,130.0 | 1,180.0 | 1,200.0 | 1,180.0 | 1,230.0 | 1,260.0 | 1,050.0 | 1,150.0 | 1,090.0 | 1,190.0 |
| Direct Sources | 962.0 | 861.0 | 878.0 | 921.0 | 926.0 | 910.0 | 956.0 | 971.0 | 804.0 | 889.0 | 833.0 | 904.0 |
| Indirect Sources | 241.0 | 229.0 | 253.0 | 258.0 | 273.0 | 270.0 | 275.0 | 292.0 | 246.0 | 257.0 | 259.0 | 288.0 |
| LAND USE CHANGE AND FORESTRY (non-CO2 only)3 | 1,590.0 | 1,850.0 | 1,420.0 | 1,250.0 | 518.0 | 205.0 | 453.0 | 444.0 | 443.0 | 443.0 | 495.0 | 492.0 |
| Prescribed Burns | 1,400.0 | 1,810.0 | 1,360.0 | 1,240.0 | 443.0 | 107.0 | 443.0 | 443.0 | 443.0 | 443.0 | 443.0 | 443.0 |
| Wildfires in the Wood Production Forest | 191.0 | 40.8 | 62.4 | 5.0 | 75.2 | 97.5 | 9.7 | 1.0 | - | - | 52.1 | 48.6 |
| WASTE | 3,640.0 | 3,920.0 | 4,050.0 | 4,070.0 | 4,170.0 | 4,300.0 | 4,620.0 | 4,720.0 | 4,810.0 | 4,960.0 | 5,040.0 | 5,120.0 |
| a. Solid Waste Disposal on Land | 3,390.0 | 3,660.0 | 3,780.0 | 3,800.0 | 3,890.0 | 4,010.0 | 4,330.0 | 4,420.0 | 4,500.0 | 4,650.0 | 4,730.0 | 4,810.0 |
| b. Wastewater Handling | 185.0 | 189.0 | 195.0 | 200.0 | 207.0 | 212.0 | 218.0 | 222.0 | 224.0 | 226.0 | 228.0 | 230.0 |
| c. Waste Incineration | 66.7 | 68.4 | 70.4 | 72.4 | 74.6 | 76.7 | 78.7 | 80.3 | 81.1 | 81.7 | 82.4 | 83.0 |
Notes:
1 Emissions Associated with the use of HFCs, PFCs, Limestone and soda ash are reported in the national industrial processes total.
2 Ammonia Production emissions are included under undifferentiated production at the provincial level.
3 CO2 emissions and removals in the LUCF sector are not included in the national totals. Non CO2 emission from fires located in the National Parks are not included in the provincial/territorial totals but are reported in the national totals.